This gotta be the worst post title I have ever created in my life so far.
So, after the last posting, I moved on to the task of trying to import the dataset into SPSS with the problem in mind... on this spreadsheet, the values of column G, I, K, M are variable names while numerical values in column H, J, L, N alike are the values the respective variables associated a specific participant. In total, there are something like 20 participants.... (See image below)
I was just gonna go and do that copying, transposing and pasting etc.
Yes, giving lazy buns a task to complete, they often spend more time trying to find the short-cut than if they had just done things the KISS (keep it simple and stupid) way.
Yet, I tried to find the most efficient way-- though did explore a bit with different software.
The million-dollar question is: "How do you convert an Excel spreadsheet looking like the above into an SPSS file like below with all 941 variable names accurately created and data associated with each id imported?"
This one I had to figure out myself since, shame on my, my SQL skills are rusty and hadn't done much of VB script stuffs etc in my entire life. In addition, it is difficult to google up solutions for a problem when I am not even quite sure how to put the problem in words.
Ended up, the solution I found was simple though exploration did take a little time.
Essentially, use the Pivot table function to turn your data to look like the following. I had to create five sets of Pivot tables to get all data printed out.
Since you can not get rid of the first 3 rows in the Pivot table, what I did was to copy everything I need from the fourth row down to a different spreadsheet and used SPSS to import that new spreadsheet with the first row as the variable names.
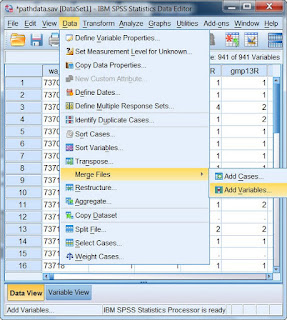
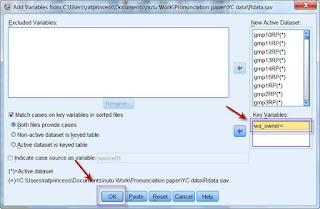
After all 5 spreadsheets were imported into SPSS, the next was simple. Use the Merge file option under Data to add variables. Once the add variable window is open, make sure that you assign a key variable, which is correctly sorted, so that values of the added variables would be linked to the correct id. It was not an issue for me since the values were already in ascending order.
One last question, how did someone like me who had never used Pivot table to get it set up so fast?
If you are like me, well, I actually a detour by going through MS Access 2010 since I know how to pull the Pivot Table view out in Access. So I imported the spreadsheet containing all data as a table in an access database, get to the pivot table view, get the data printed out in the table correctly and export it back to Excel.
Though stupid... it surely was much faster than me having to update myself on the entire Excel Pivot Table chapter... 8-O lol
Though nothing elegant, now that I got it out once, would be no sweat next time....
Hope it helps you, too!
BTW, please let me know if you need help playing with them pivot tables... put up out some tutorial kinda thing upon request.
(Messed up on one set of values and finally got the complete file compiled... with a total of 1176 variables. 8-X)
So, after the last posting, I moved on to the task of trying to import the dataset into SPSS with the problem in mind... on this spreadsheet, the values of column G, I, K, M are variable names while numerical values in column H, J, L, N alike are the values the respective variables associated a specific participant. In total, there are something like 20 participants.... (See image below)
I was just gonna go and do that copying, transposing and pasting etc.
Yes, giving lazy buns a task to complete, they often spend more time trying to find the short-cut than if they had just done things the KISS (keep it simple and stupid) way.
Yet, I tried to find the most efficient way-- though did explore a bit with different software.
The million-dollar question is: "How do you convert an Excel spreadsheet looking like the above into an SPSS file like below with all 941 variable names accurately created and data associated with each id imported?"
This one I had to figure out myself since, shame on my, my SQL skills are rusty and hadn't done much of VB script stuffs etc in my entire life. In addition, it is difficult to google up solutions for a problem when I am not even quite sure how to put the problem in words.
Ended up, the solution I found was simple though exploration did take a little time.
Essentially, use the Pivot table function to turn your data to look like the following. I had to create five sets of Pivot tables to get all data printed out.
Since you can not get rid of the first 3 rows in the Pivot table, what I did was to copy everything I need from the fourth row down to a different spreadsheet and used SPSS to import that new spreadsheet with the first row as the variable names.
After all 5 spreadsheets were imported into SPSS, the next was simple. Use the Merge file option under Data to add variables. Once the add variable window is open, make sure that you assign a key variable, which is correctly sorted, so that values of the added variables would be linked to the correct id. It was not an issue for me since the values were already in ascending order.
 |
| Select "Add Variables under "Merge Files" |
 |
| Make sure you define the key variable (e.g., Id) and make sure the values are sorted. |
If you are like me, well, I actually a detour by going through MS Access 2010 since I know how to pull the Pivot Table view out in Access. So I imported the spreadsheet containing all data as a table in an access database, get to the pivot table view, get the data printed out in the table correctly and export it back to Excel.
Though stupid... it surely was much faster than me having to update myself on the entire Excel Pivot Table chapter... 8-O lol
Though nothing elegant, now that I got it out once, would be no sweat next time....
Hope it helps you, too!
BTW, please let me know if you need help playing with them pivot tables... put up out some tutorial kinda thing upon request.
(Messed up on one set of values and finally got the complete file compiled... with a total of 1176 variables. 8-X)


No comments:
Post a Comment